What El Niño Actually Does to Colorado Winters, By the Numbers
A grid-point analysis of every El Niño winter back to 1951 tells a more specific Colorado story than "wetter and warmer." Part of it runs backward from what most coverage assumes.

What El Niño Actually Does to Colorado Winters, By the Numbers
Every strengthening El Niño brings the same two claims: wetter, and warmer. For Colorado, only one of those holds up against 75 years of data. It's not the one getting repeated.
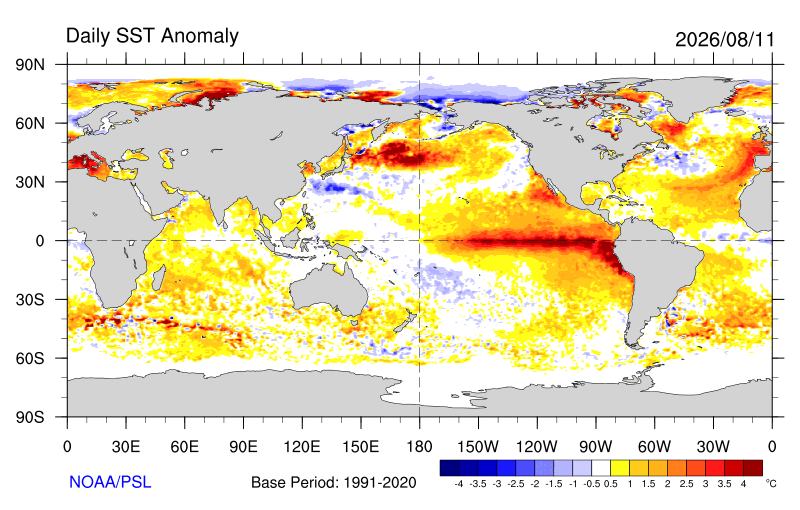
With this event now favored to become the strongest El Niño on record, it's worth asking what the state's own weather history actually says, at the level of specific towns rather than the whole Southwest. Every El Niño winter back to 1951 was checked against reanalysis climate data at five Colorado locations (Denver, Fort Collins, Grand Junction, Durango, and Alamosa) to see how each one behaved, not just the region as a whole.
The temperature story splits the state in two. Across all 22 El Niño winters on record, Denver and Fort Collins come in close to a coin flip on cold-season temperature: the Front Range's El Niño temperature signal is genuinely weak. Durango tells a different story. 77% of El Niño cold seasons there ran colder than normal, not warmer, one of the more one-sided signals in the entire dataset, in a state where El Niño's temperature fingerprint is usually much weaker and noisier than that. Alamosa and Grand Junction sit in between. The popular shorthand that "El Niño means a mild winter" simply doesn't apply to southern and western Colorado, where the more reliable outcome is closer to average or below.
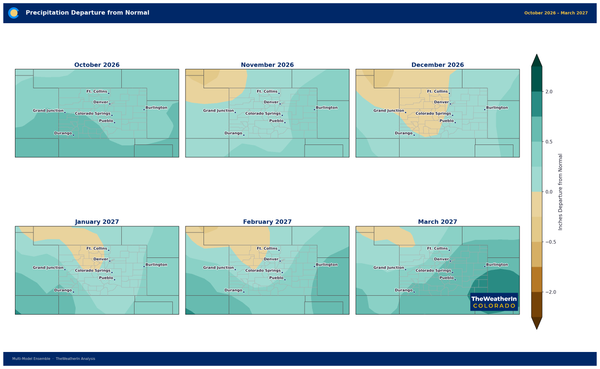
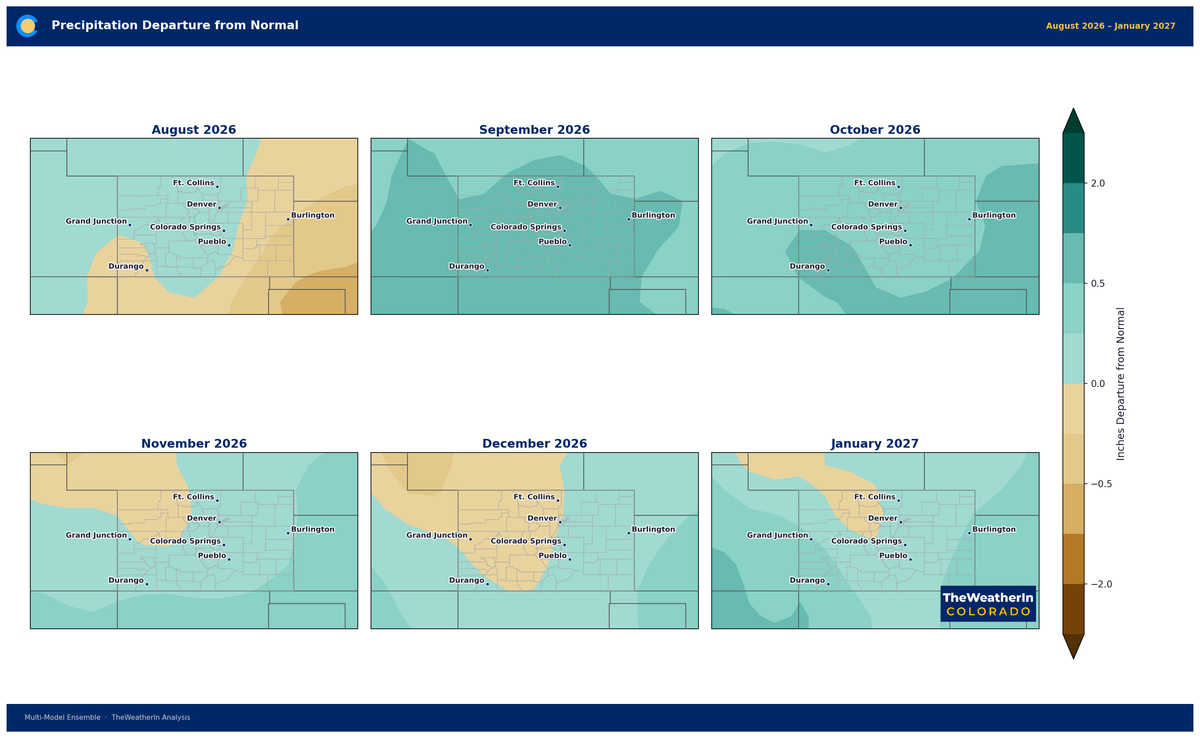
Precipitation leans wet almost everywhere, but not dramatically. Every location tested saw more El Niño winters run wetter than normal than drier: Denver led at 73% of years, with the rest of the state clustering in the high 50s to mid-60s. That's a real tilt, not a coin flip, but it's a tilt, not a guarantee; roughly one in three El Niño winters still comes in dry at any given location.
| Location | Colder-Than-Normal Winters | Wetter-Than-Normal Winters | Above-Normal Spring Snow |
|---|---|---|---|
| Denver / Front Range | 55% | 73% | 68% |
| Fort Collins / Northern CO | 50% | 64% | 50% |
| Grand Junction / Western Slope | 64% | 64% | 64% |
| Durango / San Juans | 77% | 59% | 64% |
| Alamosa / San Luis Valley | 59% | 59% | 64% |
Share of El Niño cold seasons (Nov–Apr) since 1951 that ran colder or wetter than the 1991–2020 average, and El Niño springs (Mar–May) with above-normal snowfall, at the nearest climate-data grid point to each location. 22 qualifying events.
The signal nobody talks about is spring. Ask most people when El Niño helps Colorado's snowpack, and they'll say midwinter. The data says otherwise. The strongest, most consistent snow signal at every location tested shows up in March through May, not December through February. That matters more than usual this year, because Colorado's snowpack collapsed to the lowest levels on record this past winter, and a below-average spring snow season on top of a bad one would leave next summer's water supply in the same hole. A statewide tilt toward above-normal spring snow, which is exactly what this dataset shows for El Niño years, is a genuinely useful signal for reservoir operators and irrigators planning 2027, even though it says nothing about the months between now and then.
How confident should any of this make you? Reasonably, but not completely. Only three El Niño winters since 1951 have reached the "strong" threshold this event is favored to reach or exceed: 1982-83, 1997-98, and 2015-16. Denver and Grand Junction went a clean 3-for-3 in those years: colder than normal, wetter than normal, and snowier than normal, every single time. Durango ran colder and snowier in all three as well, but only one of the three was actually wetter than normal there, even though the average across all three leans wet. That gap is exactly what a three-event sample can hide: one very wet year pulls the average up while most of the individual years still miss it. And forecasters now say there's a two-in-three chance this event ends up bigger than all three of those combined, which means the closest historical comparisons may undersell what's coming rather than overstate it. It's also worth noting that even the strongest El Niño winters on record haven't eliminated cold outbreaks east of the Rockies; a strong wet-and-cool tilt for southern Colorado is the favored outcome, not a locked-in one.
Current long-range guidance for Colorado this January through March points in the same direction the historical data does: a cooler-than-normal signal statewide, sharpest across southeastern Colorado, alongside a wetter-than-normal signal that's strongest on the Western Slope and across the southern half of the state and weakest along the urban Front Range corridor.
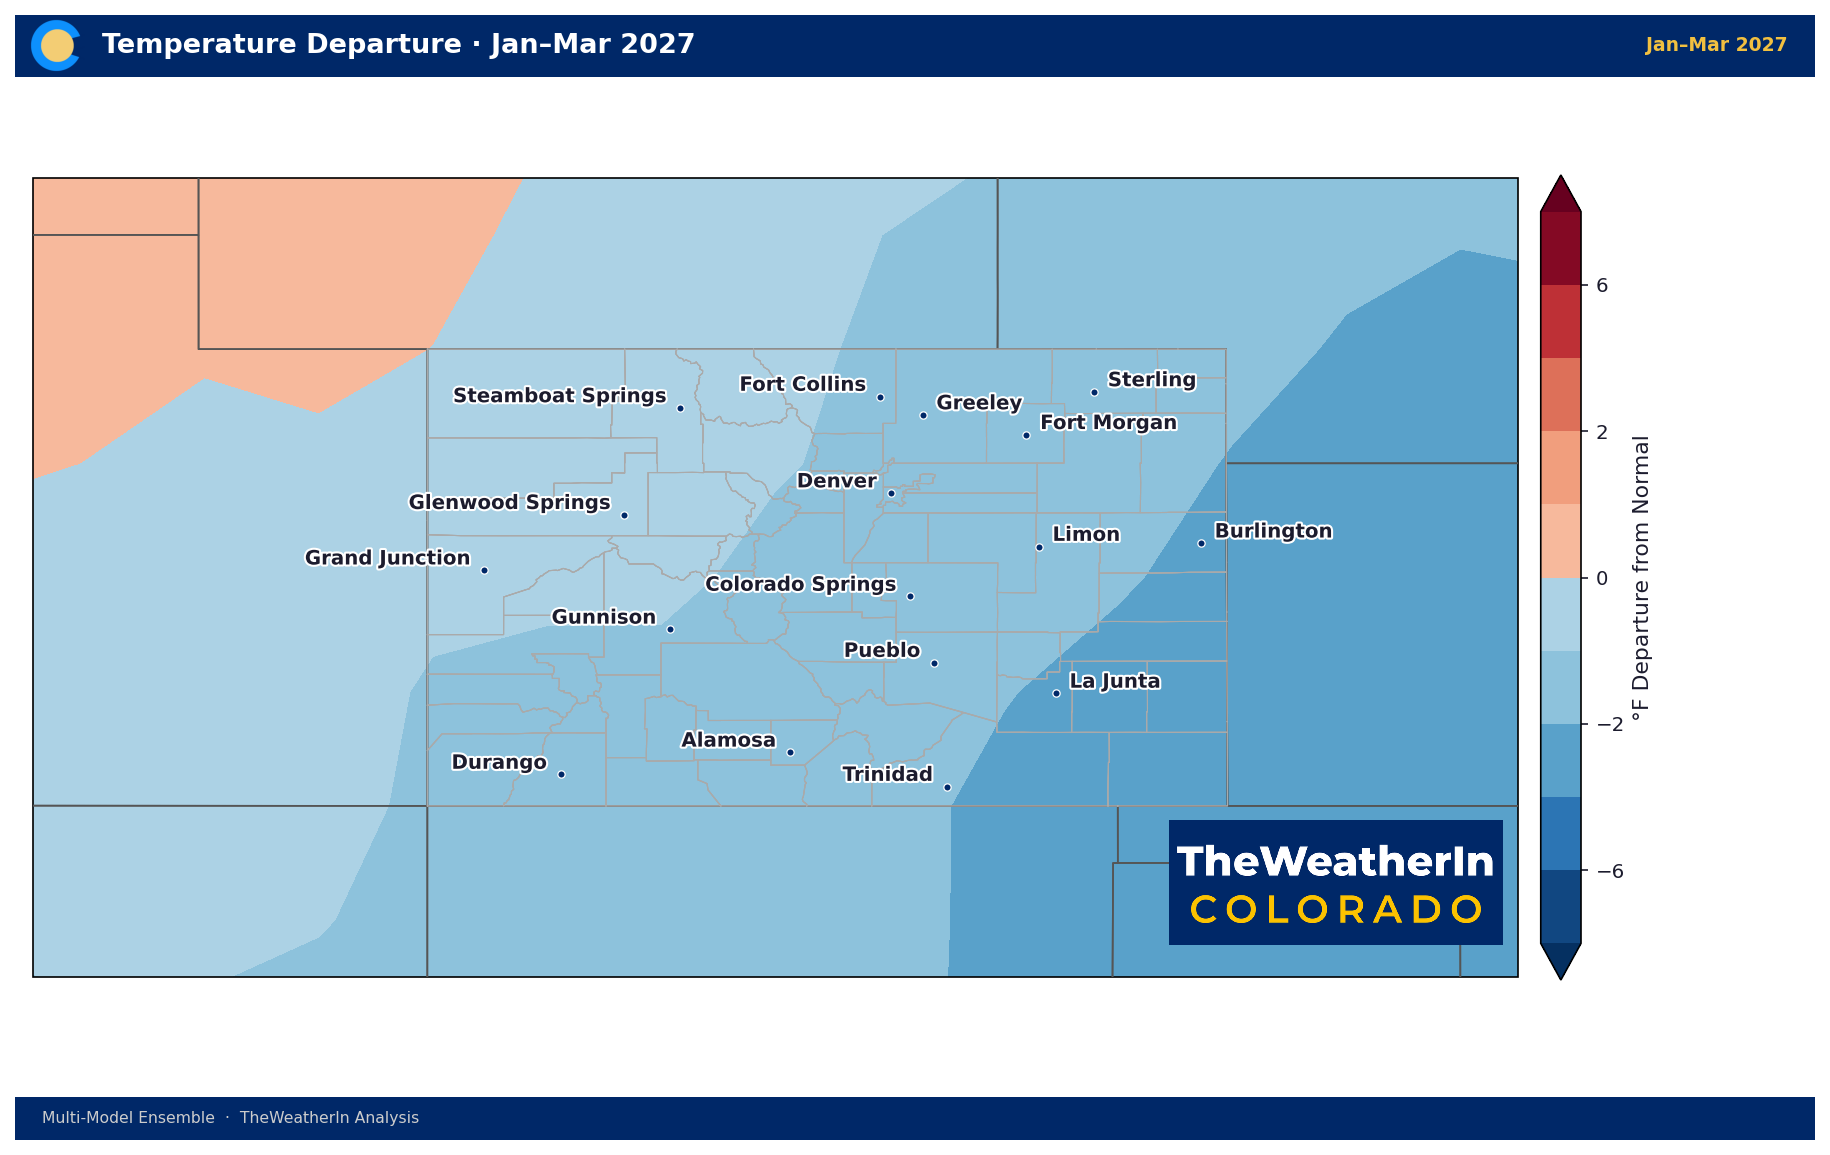
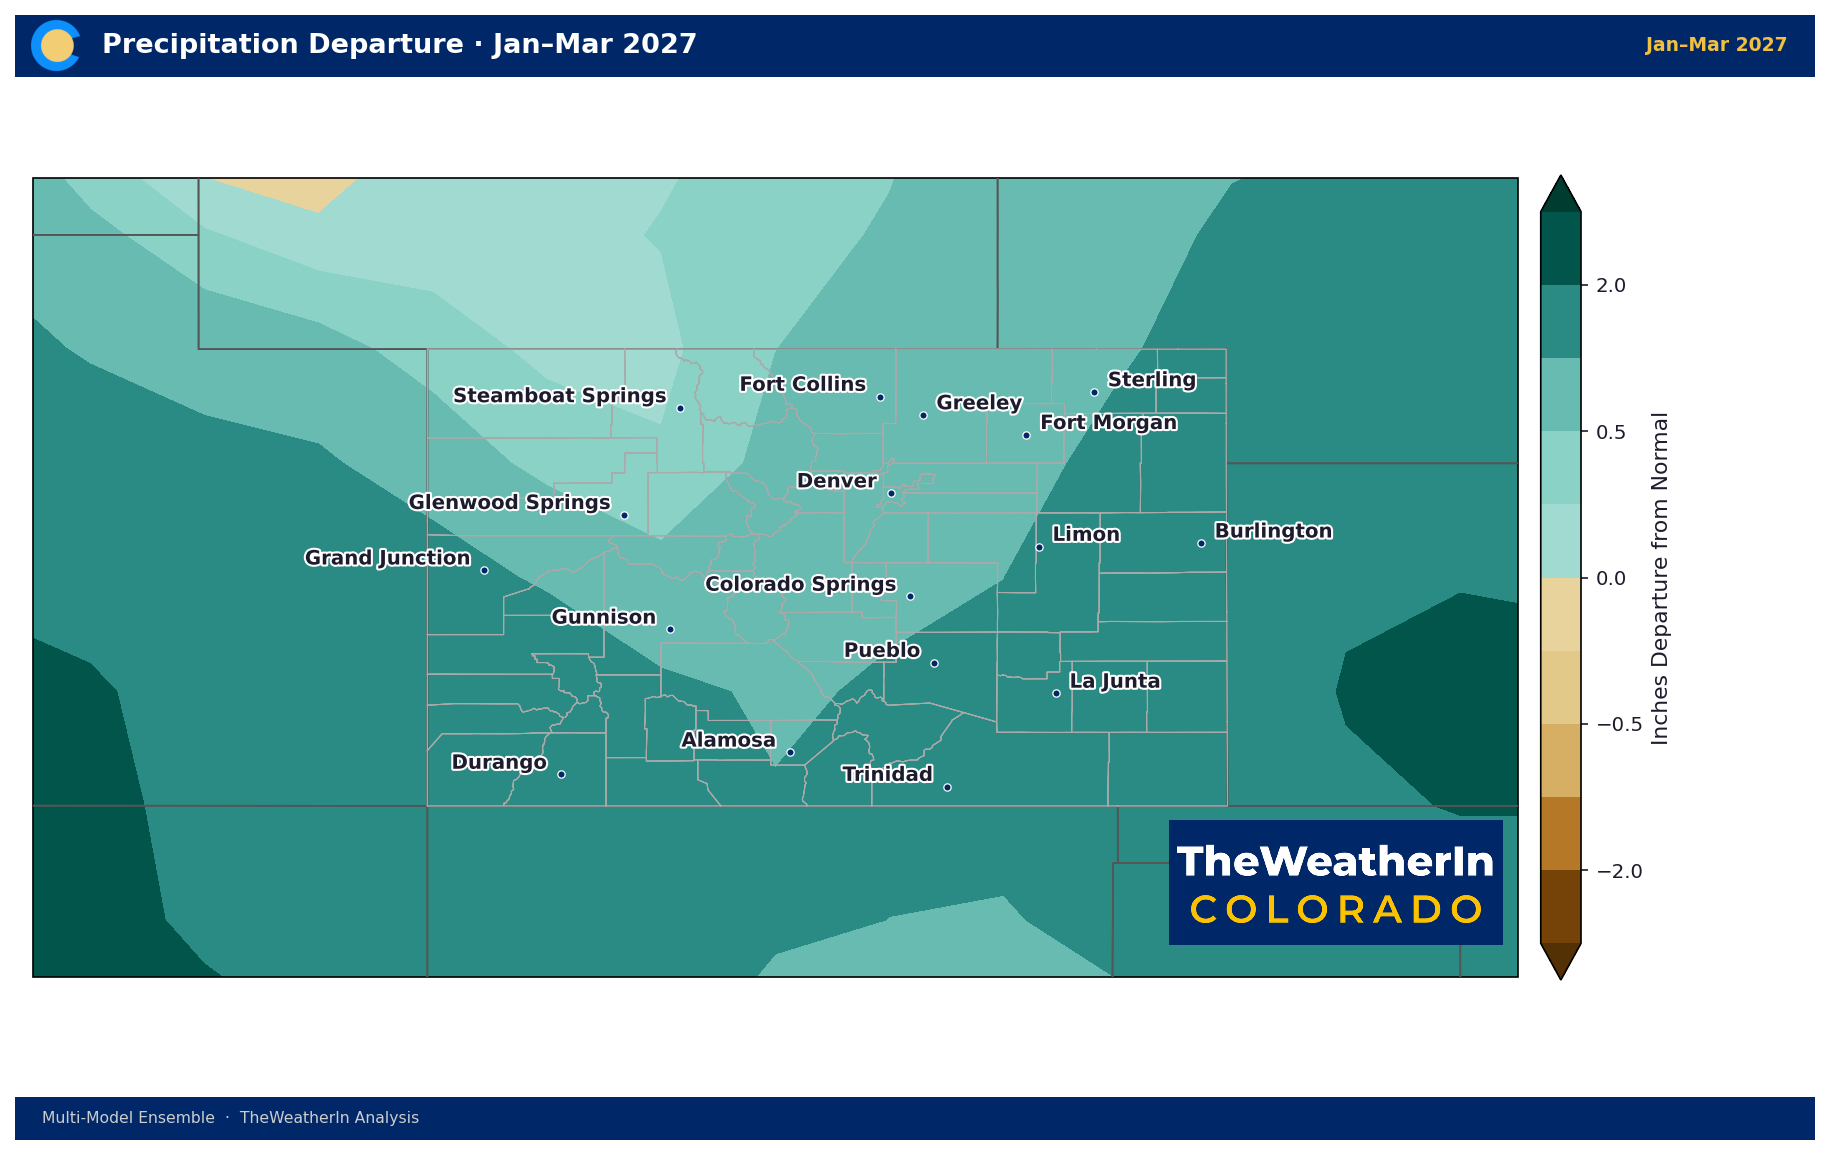
When 75 years of history and the current outlook point the same direction, that agreement is exactly what raises confidence in a seasonal forecast.
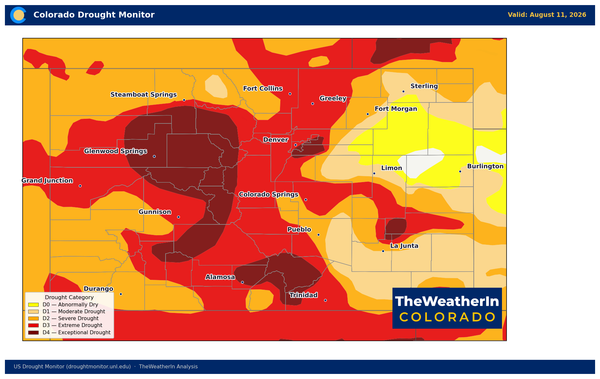
None of this touches where Colorado stands today. As of August 18, 97.2% of the state remains abnormally dry or worse, with almost half the state in extreme-to-exceptional drought and the statewide drought index back near its summer peak.
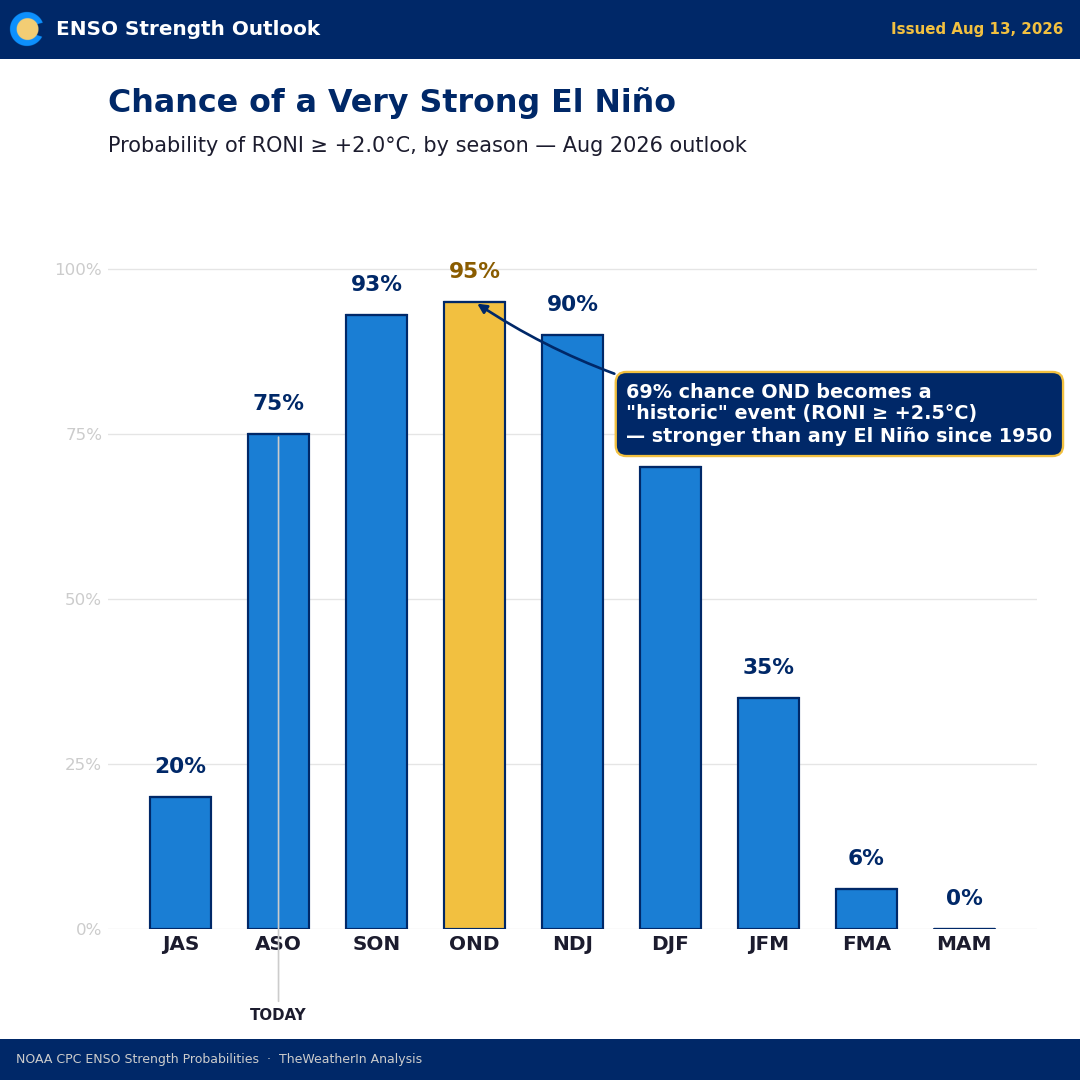
A strengthening, possibly record, El Niño raises the odds of a wetter winter and a better spring snowpack than last year's collapse. It does not touch the deficit sitting on the ground right now, and the strongest part of this signal doesn't arrive until winter regardless of how the ocean behaves between now and then.
The next official ENSO update lands September 10. Until then, the number worth watching isn't the strength of the event. It's whether the current forecast for a historic winter holds up as the season gets closer.